Market Outlook
May 03, 2018
Market Cues
Domestic Indices
Chg (%)
(Pts)
(Close)
Indian markets are likely to open negative tracking global indices and SGX Nifty.
BSE Sensex
0.0
16
35,176
U.S. Stocks came under pressure in late-day trading following the Federal Reserve's
Nifty
(0.2)
(21)
10,718
announcement of its latest monetary policy decision. The major averages pulled
Mid Cap
(1.2)
(198)
16,814
back firmly into negative territory, with the Dow falling to its lowest closing level in a
Small Cap
(1.2)
(212)
18,190
month. The Dow Jones fell by 0.7 percent to 23,924 and the Nasdaq ended down
by 0.4 percent to 7,100.
Bankex
(0.1)
(37)
28,615
U.K. stocks stock market is higher today and looks on course to end on a positive
Global Indices
Chg (%)
(Pts)
(Close)
note for the fourth successive session. The FTSE 100 was up by 0.3% to end at
7,520.
Dow Jones
(0.7)
(174)
23,924
Nasdaq
(0.4)
(30)
7,100
On domestic front, Indian shares start on a strong note on the back of some hectic
FTSE
0.3
22
7,520
buying in automobile stocks- thanks to buoyant sales data, the Indian stock market
ended flat during the last trading session. The BSE Sensex ended flat at 35,176.
Nikkei
(0.2)
(35)
22,473
Hang Seng
(0.3)
(85)
30,724
News Analysis
Shanghai Com
(0.0)
(1)
3,081
Update on L&T Finance Holding
Detailed analysis on Pg2
Advances / Declines
BSE
NSE
Advances
904
966
Investor’s Ready Reckoner
Declines
1,825
840
Key Domestic & Global Indicators
Unchanged
111
84
Stock Watch: Latest investment recommendations on 150+ stocks
Refer Pg5 onwards
Volumes (` Cr)
Top Picks
BSE
2,881
CMP
Target
Upside
Company
Sector
Rating
(`)
(`)
(%)
NSE
35,015
Blue Star
Capital Goods Accumulate
800
867
8.4
Dewan Housing Finance
Financials
Buy
648
720
11.0
Net Inflows (` Cr)
Net
Mtd
Ytd
Century Plyboards
Forest Product
Buy
324
400
23.5
FII
(100)
(4,952)
8,655
Navkar Corporation
Others
Buy
177
265
49.8
*MFs
409
8,173
42,632
KEI Industries
Capital Goods Accumulate
437
485
10.9
More Top Picks on Pg4
Top Gainers
Price (`)
Chg (%)
Key Upcoming Events
Previous
Consensus
VIDEOIND
11
10.0
Date
Region
Event Description
ReadingExpectations
IBVENTUREPP
328
9.6
May 03, 2018 Euro Zone Euro-Zone GDP s.a. (QoQ)
0.40
0.40
LAKSHVILAS
95
6.5
May 04, 2018 Germany PMI Services
54.10
54.10
EQUITAS
165
6.4
May 04, 2018 China
Exports YoY%
(2.70)
8.00
May 04, 2018 US
Change in Nonfarm payrolls
103.00
191.00
IBVENTURES
512
6.2
May 08, 2018 US
Unnemployment rate
4.10
4.00
More Events on Pg7
Top Losers
Price (`)
Chg (%)
PCJEWELLER
111
-23.7
CENTURYTEX
1144
-9.4
REPCOHOME
586
-9.1
JUSTDIAL
407
-8.7
ADANIENT
129
-7.7
As on April 30, 2018
Market Outlook
May 03, 2018
News Analysis
Update on L&T Finance Holding
L&T Finance Holdings Ltd (LTFH), promoted by L&T Ltd (64.2%) is a leading NBFC
with a diversified lending portfolio. We expect going forward advance to grow at
healthy CAGR of 24% over FY17-FY20E, primarily owing to focused lending
segment (rural, housing and wholesale) and better managed credit cost would
further help to improve return ratio. At CMP LTFH is trading at 2.5x of FY20 AdjBV.
We recommend a Buy rating on the stock, with a target price of `210.
Y/E March (` cr)
FY16
FY17
FY18E
FY19E
FY20E
NII
2,693
3,034
3,686
4,674
5,846
% chg
15
13
21
27
25
Net profit
854
1,043
1,345
1,931
2,479
% chg
17
22
29
44
28
NIM (%)
5.3
5.1
5.2
5.2
5.3
EPS (`)
4
5
6
9
11
P/E (x)
44
36
28
19
15
P/ABV (x)
5.0
4.6
4.3
2.9
2.5
RoA (%)
1
2
2
2
2
RoE (%)
11
12
14
16
16
Economic and Political News
Government approves continuation of merged agriculture schemes with Rs
332.6bn outlay
Modi Cabinet approves 'investment bonanza' for 2,23,000 senior citizens
Corporate News
NCLT asks Binani Cement's CoC to consider UltratTech's revised bid
Amazon makes formal bid to buy 60% stake in Flipkart
NBCC bags Rs 20-bn order from Centre to build MGCC in African countries
IndiGo Q4 profit plunges 73% on higher expenses at Rs 1.18 billion
Market Outlook
May 03, 2018
Quarterly Bloomberg Brokers Consensus Estimate
Vedanta Ltd - May 03, 2018
Particulars ( ` cr)
4QFY18E
4QFY17
y-o-y (%)
3QFY18
q-o-q (%)
Sales
25098
22511
11.5
24361
3.0
EBIDTA
7176
7236
(0.8)
6605
8.6
%
28.6
32.1
27.1
PAT
2730
4225
(35.4)
2959
(7.7)
MRF Ltd - May 03, 2018
Particulars ( ` cr)
4QFY18E
4QFY17
y-o-y (%)
3QFY18
q-o-q (%)
Sales
3919
3338
17.4
3798
3.2
EBIDTA
740
523
41.5
703
5.3
%
18.9
15.7
18.5
PAT
405
287
41.1
341
18.8
Adani Ports Ltd - May 03, 2018
Particulars ( ` cr)
4QFY18E
4QFY17
y-o-y (%)
3QFY18
q-o-q (%)
Sales
2626
2231
17.7
2688
(2.3)
EBIDTA
1713
1638
4.6
877
95.3
%
65.2
73.4
67.4
PAT
1030
1164
(11.5)
994
3.6
Market Outlook
May 03, 2018
Top Picks
Market Cap
CMP
Target
Upside
Company
Rationale
(` Cr)
(`)
(`)
(%)
Strong growth in domestic business due to its
leadership in acute therapeutic segment. Alkem
Alkem Laboratories
23,913
2,000
2,441
22.1
expects to launch more products in USA, which
bodes for its international business.
Favorable outlook for the AC industry to augur well
for Cooling products business which is out pacing
Blue Star
7,676
800
867
8.4
the market growth. EMPPAC division's profitability
to improve once operating environment turns
around.
With a focus on the low and medium income (LMI)
consumer segment, the company has increased its
Dewan Housing Finance
20,339
648
720
11.0
presence in tier-II & III cities where the growth
opportunity is immense.
Well capitalized with CAR of 18.1% which gives
sufficient room to grow asset base. Faster resolution
ICICI Bank
178,130
277
416
50.1
of NPA would reduce provision cost, which would
help to report better ROE.
High order book execution in EPC segment, rising
KEI Industries
3,426
437
485
10.9
B2C sales and higher exports to boost the revenues
and profitability
Expected to benefit from the lower capex
Music Broadcast Limited
2,145
376
475
26.3
requirement and 15 year long radio broadcast
licensing.
Massive capacity expansion along with rail
Navkar Corporation
2,663
177
265
49.8
advantage at ICD as well CFS augur well for the
company
Strong brands and distribution network would boost
Siyaram Silk Mills
3,140
670
851
27.0
growth going ahead. Stock currently trades at an
inexpensive valuation.
Market leadership in Hindi news genre and no. 2
viewership ranking in English news genre, exit from
TV Today Network
2,743
460
603
31.2
the radio business, and anticipated growth in ad
spends by corporate to benefit the stock.
After GST, the company is expected to see higher
volumes along with improving product mix. The
Maruti
264,408
8,753
10,619
21.3
Gujarat plant will also enable higher operating
leverage which will be margin accretive.
We expect loan book to grow at 24.3% over next
GIC Housing
2,289
425
655
54.1
two year; change in borrowing mix will help in NIM
improvement
We expect CPIL to report net Revenue/PAT CAGR of
~17%/16% over FY2017-20E mainly due to
Century Plyboards
7,197
324
400
23.5
healthy growth in plywood & lamination business,
forayed into MDF & Particle boards on back of
strong brand & distribution network.
We expect sales/PAT to grow at 13.5%/20% over
LT Foods
2,858
89
128
43.3
next two years on the back of strong distribution
network & addition of new products in portfolio.
Third largest brand play in luggage segment
Increased product offerings and improving
Safari Industries
1,436
645
750
16.2
distribution network is leading to strong growth in
business. Likely to post robust growth for next 3-4
years
We expect HSIL to report PAT CAGR of ~15% over
FY2017-20E owing to better improvement in
HSIL Ltd
2,645
366
510
39.4
operating margin due price hike in container glass
segment, turnaround in consumer business.
Source: Company, Angel Research
Market Outlook
May 03, 2018
Top Picks
Market Cap
CMP
Target
Upside
Company
Rationale
(` Cr)
(`)
(`)
(%)
We expect financialisation of savings and
Aditya Birla Capital
35107
160
230
43.0
increasing penetration in Insurance & Mutual fund
would ensure steady growth.
One of the leading Indian dairy products
companies in India created strong brands in dairy
products. Rising revenue share of high-margin
Parag Milk Foods
2,575
306
333
9.1
Value Added Products and reduction in interest cost
is likely to boost margins and earnings in next few
years.
We expect MCL to report net revenue CAGR of
~15% to ~`450cr over FY2018-20E mainly due to
strong growth in online matchmaking & marriage
Matrimony.com Ltd
1,887
831
984
18.4
related services. On the bottom-line front, we
expect a CAGR of ~28% to `82cr over the same
period on the back margin improvement.
HDFC Bank maintained its steady growth in the
4QFY18. The bank’s net profit grew by 20.3%.
Steady growth in interest income and other income
HDFC Bank
5,11,695
1,970
2,315
17.5
aided PAT growth. The Strong liability franchise
and healthy capitalisation provides strong earning
visibility. At the current market price, the bank is
trading at 3.2x FY20E ABV.
Source: Company, Angel Research
Fundamental Call
Market Cap
CMP
Target
Upside
Company
Rationale
(` Cr)
(`)
(`)
(%)
CCL is likely to maintain the strong growth trajectory
CCL Products
4,135
311
360
15.8
over FY18-20 backed by capacity expansion and
new geographical foray
We forecast Nilkamal to report top-line CAGR of
~9% to `2,635cr over FY17-20E on the back of
Nilkamal
2,510
1,682
2,178
29.5
healthy demand growth in plastic division. On the
bottom-line front, we estimate
~10% CAGR to
`162cr owing to improvement in volumes.
The prism has diversified exposure in the different
segment such as Cement, Tile & ready mix concrete.
Prism Cement
6,068
121
160
32.7
Thus we believe, PCL is in the right place to capture
ongoing government spending on affordable
housing and infrastructure projects.
Elantas Beck India is the Indian market leader in
liquid insulation segment used in electrical
equipments like motors, transformers etc. It derives
Elantas Beck India Ltd
1,806
2,278
2,500
9.7
demand from several industries which are expected
to register 10%+ CAGR in demand in the coming
years.
Greenply Industries Ltd (GIL) manufactures plywood
& allied products and medium density fibreboards
(MDF). GIL to report net revenue CAGR of ~14% to
Greenply Industries
3,777
308
395
28.2
~`2,478cr over FY2017-20E mainly due to healthy
growth in plywood & lamination business on the
back of strong brand and distribution network
GMM Pfaudler Limited (GMM) is the Indian market
leader in glass-lined (GL) steel equipment. GMM is
expected to cross CAGR 15%+ in revenue over the
GMM Pfaudler Ltd
1,133
775
861
11.1
next few years mainly led by uptick in demand from
user industries and it is also expecting to increase its
share of non-GL business to 50% by 2020.
Market Outlook
May 03, 2018
Key Upcoming Events
Result Calendar
Date
Company
May 03, 2018
Hexaware, Sesa Goa, MRF, Adani Power, Radico Khaitan
May 04, 2018
Ambuja Cements, Bank of Maharashtra, Godrej Consumer, PVR, Elecon Engineering
Source: Bloomberg, Angel Research
Global economic events release calendar
Bloomberg Data
Date
Time
Country
Event Description
Unit
Period
Last Reported
Estimated
May 03, 2018
2:30 PMEuro Zone Euro-Zone GDP s.a. (QoQ)
% Change
1Q A
0.40
0.40
May 04, 2018
1:25 PMGermany PMI Services
Value
Apr F
54.10
54.10
China
Exports YoY%
% Change
Apr
(2.70)
8.00
6:00 PMUS
Change in Nonfarm payrolls
Thousands
Apr
103.00
191.00
May 08, 2018
6:00 PMUS
Unnemployment rate
%
Apr
4.10
4.00
May 09, 2018
US
Producer Price Index (mom)
% Change
Apr
0.20
May 10, 2018
6:00 PMUS
Consumer price index (mom)
% Change
Apr
(0.10)
0.30
2:00 PMUK
Industrial Production (YoY)
% Change
Mar
2.20
7:00 AMChina
Consumer Price Index (YoY)
% Change
Apr
2.10
1.90
4:30 PMUK
BOE Announces rates
% Ratio
May 10
0.50
0.50
May 11, 2018
5:30 PMIndia
Industrial Production YoY
% Change
Mar
7.10
May 14, 2018
12:00 PMIndia
Monthly Wholesale Prices YoY%
% Change
Apr
2.47
May 15, 2018
2:00 PMUK
Jobless claims change
% Change
Apr
11.60
7:30 AMChina
Industrial Production (YoY)
% Change
Apr
6.00
6.50
India
Exports YoY%
% Change
Apr
(0.66)
Source: Bloomberg, Angel Research
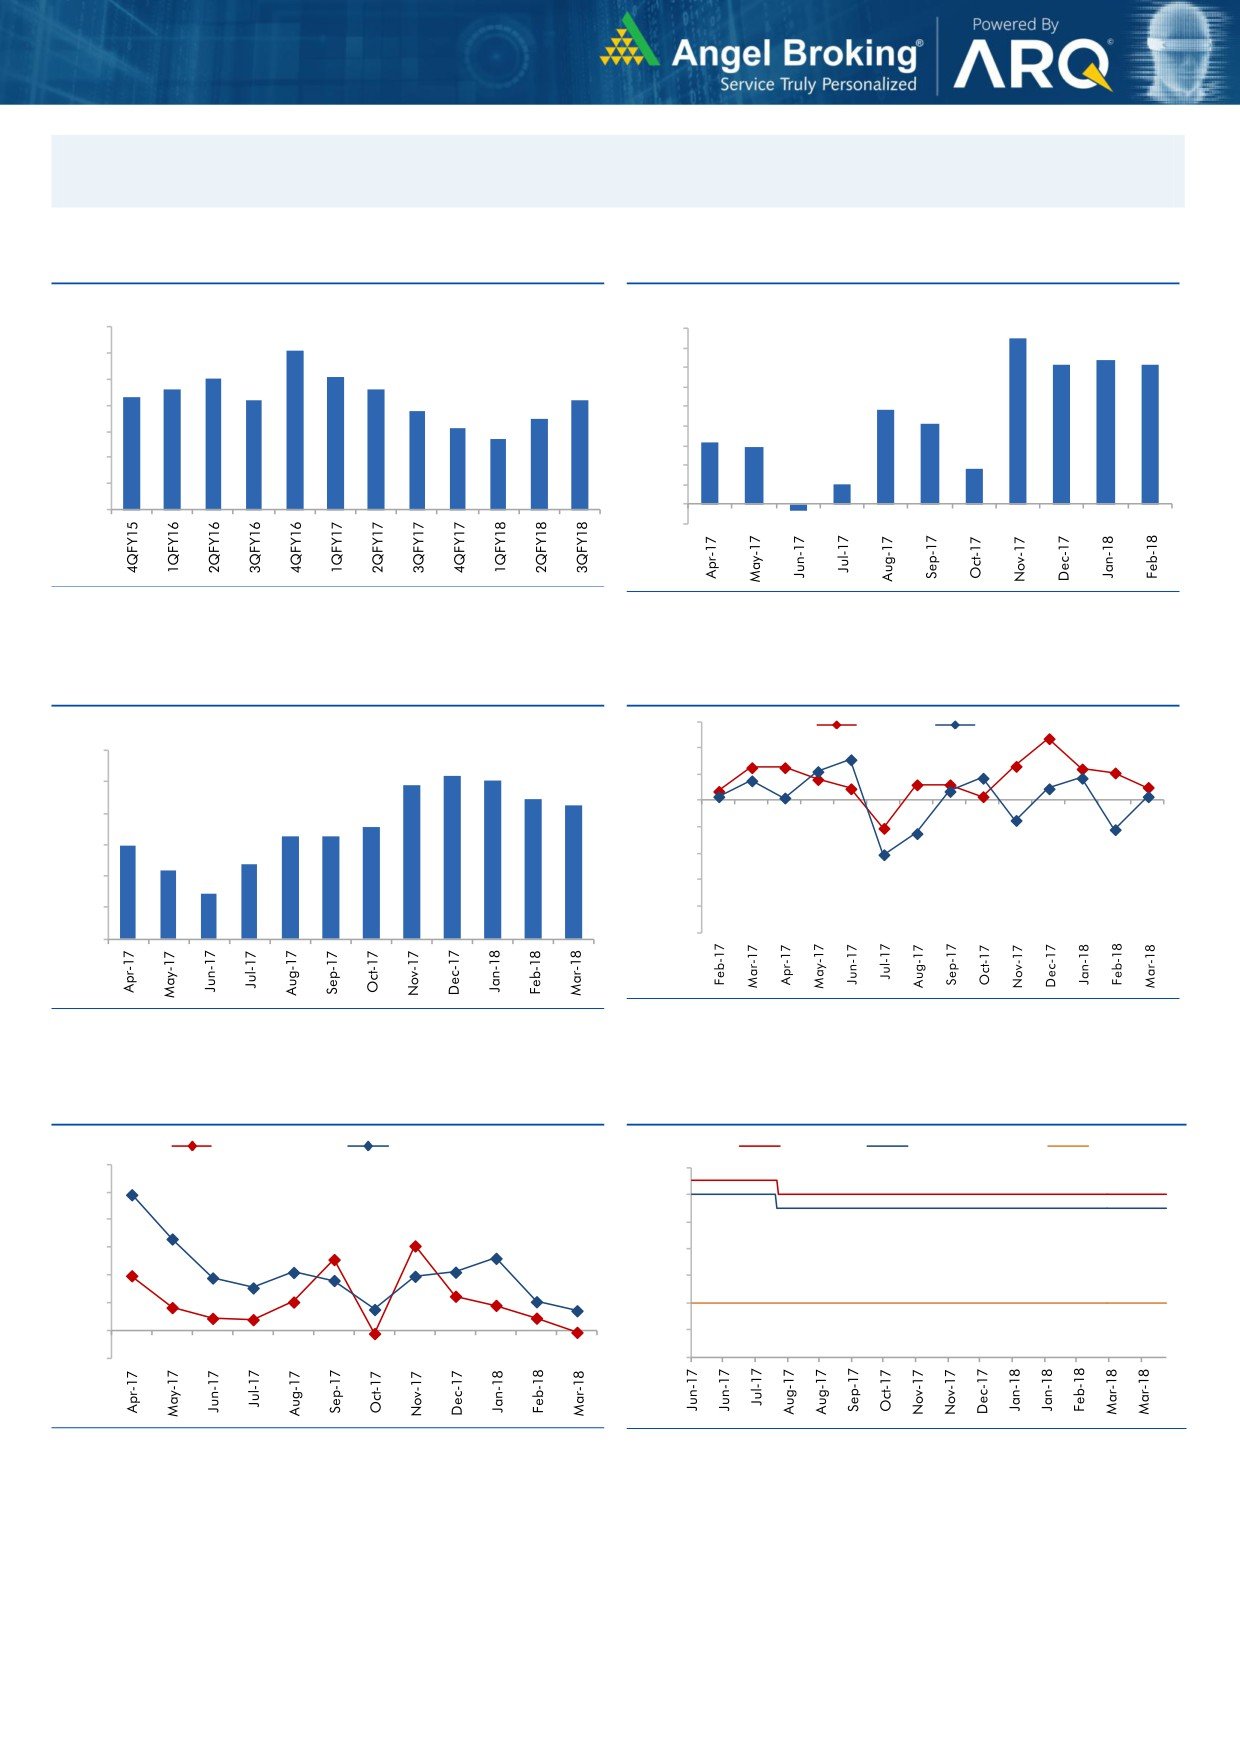
Market Outlook
May 03, 2018
Macro watch
Exhibit 1: Quarterly GDP trends
Exhibit 2: IIP trends
(%)
(%)
8.5
10.0
9.0
9.1
7.4
9.0
8.0
7.1
7.1
8.0
8.1
7.0
7.6
7.6
8.0
7.3
7.2
7.2
6.0
6.8
4.8
7.0
6.5
5.0
4.1
6.1
5.7
4.0
3.2
6.0
2.9
3.0
1.8
5.0
2.0
1.0
4.0
1.0
-
3.0
(1.0)
(0.3)
Source: CSO, Angel Research
Source: MOSPI, Angel Research
Exhibit 3: Monthly CPI inflation trends
Exhibit 4: Manufacturing and services PMI
56.0
Mfg. PMI
Services PMI
(%)
6.0
54.0
5.2
5.1
4.9
52.0
5.0
4.4
4.3
50.0
4.0
3.6
3.3
3.3
3.0
48.0
3.0
2.4
2.2
46.0
2.0
1.5
44.0
1.0
42.0
40.0
-
Source: Market, Angel Research; Note: Level above 50 indicates expansion
Source: MOSPI, Angel Research
Exhibit 5: Exports and imports growth trends
Exhibit 6: Key policy rates
(%)
Exports yoy growth
Imports yoy growth
(%)
Repo rate
Reverse Repo rate
CRR
60.0
6.50
50.0
6.00
40.0
5.50
30.0
5.00
20.0
4.50
10.0
4.00
0.0
3.50
(10.0)
3.00
Source: Bloomberg, Angel Research
Source: RBI, Angel Research
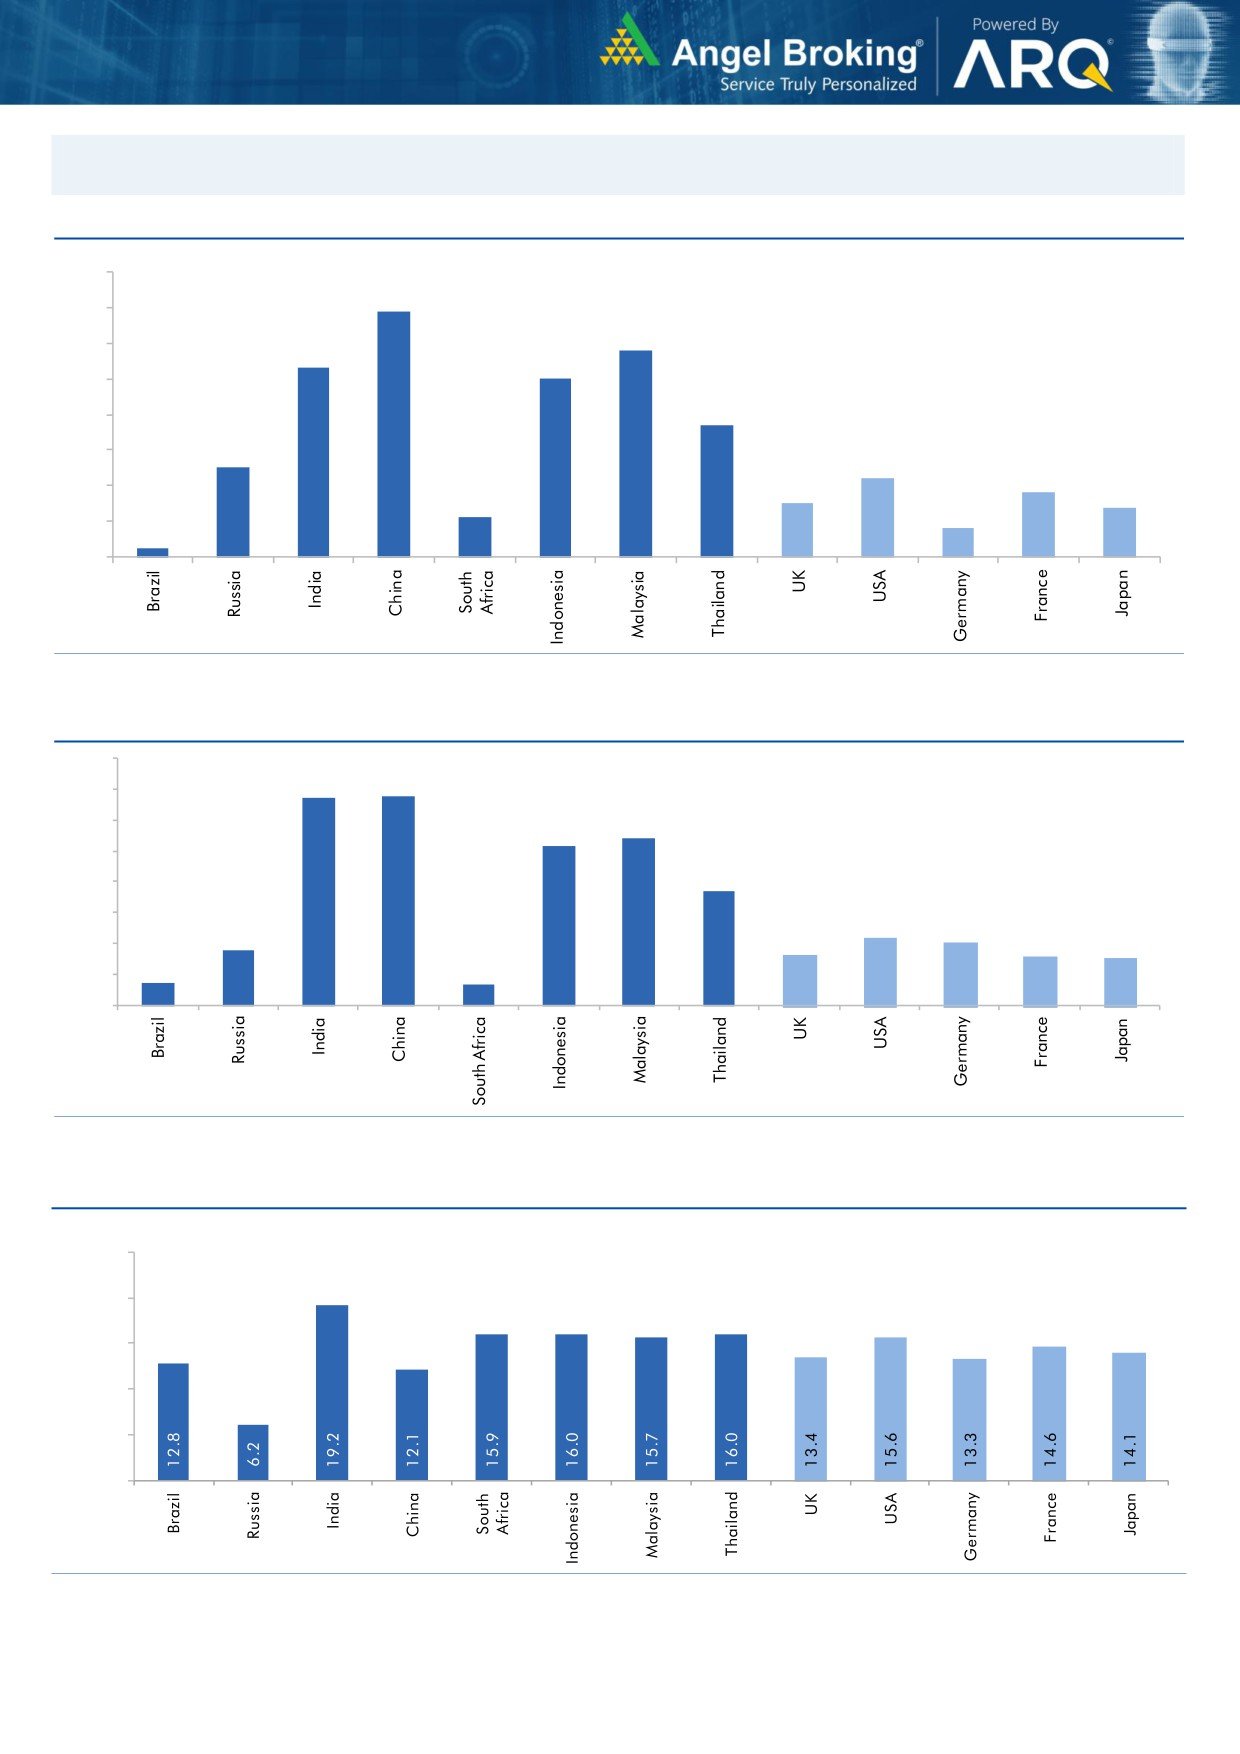
Market Outlook
May 03, 2018
Global watch
Exhibit 1: Latest quarterly GDP Growth (%, yoy) across select developing and developed countries
(%)
8.0
6.9
7.0
5.8
6.0
5.3
5.0
5.0
1.1
3.7
4.0
2.5
3.0
2.2
1.8
2.0
1.5
1.4
0.8
1.0
0.3
-
Source: Bloomberg, Angel Research
Exhibit 2: 2017 GDP Growth projection by IMF (%, yoy) across select developing and developed countries
(%)
6.7
6.8
7.0
6.0
5.4
5.2
5.0
3.7
4.0
3.0
1.8
2.2
2.0
1.7
1.6
2.0
0.7
1.5
0.7
1.0
-
Source: IMF, Angel Research
Exhibit 3: One year forward P-E ratio across select developing and developed countries
(x)
25.0
20.0
15.0
10.0
5.0
-
Source: IMF, Angel Research as on 02 May, 2018
Market Outlook
May 03, 2018
Exhibit 4: Relative performance of indices across globe
Returns (%)
Country
Name of index
Closing price
1M
3M
1YR
Brazil
Bovespa
86,116
2.7
2.9
33.7
Russia
Micex
4,533
1.4
7.1
11.4
India
Nifty
10,739
6.0
(3.3)
14.7
China
Shanghai Composite
3,082
(2.7)
(11.7)
(2.9)
South Africa
Top 40
51,419
4.3
(5.5)
9.5
Mexico
Mexbol
48,358
3.3
(4.7)
(1.8)
Indonesia
LQ45
958
(4.1)
(14.4)
4.1
Malaysia
KLCI
1,870
0.8
1.3
7.4
Thailand
SET 50
1,177
(0.2)
0.4
19.1
USA
Dow Jones
24,099
(0.0)
(8.9)
15.0
UK
FTSE
7,520
7.3
(2.0)
3.8
Japan
Nikkei
22,508
6.8
(5.1)
21.9
Germany
DAX
12,612
6.8
(4.3)
1.8
France
CAC
5,521
7.8
0.1
2.7
Source: Bloomberg, Angel Research as on 02 May, 2018 68in4
Market Outlook
May 03, 2018
Research Team Tel: 022 - 39357800
DISCLAIMER
Angel Broking Private Limited (hereinafter referred to as “Angel”) is a registered Member of National Stock Exchange of India
Limited,Bombay Stock Exchange Limited and Metropolitan Stock Exchange Limited. It is also registered as a Depository Participant with
CDSL and Portfolio Manager with SEBI. It also has registration with AMFI as a Mutual Fund Distributor. Angel Broking Private Limited is
a registered entity with SEBI for Research Analyst in terms of SEBI (Research Analyst) Regulations, 2014 vide registration number
INH000000164. Angel or its associates has not been debarred/ suspended by SEBI or any other regulatory authority for accessing
/dealing in securities Market. Angel or its associates/analyst has not received any compensation / managed or co-managed public
offering of securities of the company covered by Analyst during the past twelve months.
This document is solely for the personal information of the recipient, and must not be singularly used as the basis of any investment
decision. Nothing in this document should be construed as investment or financial advice. Each recipient of this document should
make such investigations as they deem necessary to arrive at an independent evaluation of an investment in the securities of the
companies referred to in this document (including the merits and risks involved), and should consult their own advisors to determine
the merits and risks of such an investment.
Reports based on technical and derivative analysis center on studying charts of a stock's price movement, outstanding positions and
trading volume, as opposed to focusing on a company's fundamentals and, as such, may not match with a report on a company's
fundamentals. Investors are advised to refer the Fundamental and Technical Research Reports available on our website to evaluate the
contrary view, if any.
The information in this document has been printed on the basis of publicly available information, internal data and other reliable
sources believed to be true, but we do not represent that it is accurate or complete and it should not be relied on as such, as this
document is for general guidance only. Angel Broking Pvt. Limited or any of its affiliates/ group companies shall not be in any way
responsible for any loss or damage that may arise to any person from any inadvertent error in the information contained in this report.
Angel Broking Pvt. Limited has not independently verified all the information contained within this document. Accordingly, we cannot
testify, nor make any representation or warranty, express or implied, to the accuracy, contents or data contained within this document.
While Angel Broking Pvt. Limited endeavors to update on a reasonable basis the information discussed in this material, there may be
regulatory, compliance, or other reasons that prevent us from doing so.
This document is being supplied to you solely for your information, and its contents, information or data may not be reproduced,
redistributed or passed on, directly or indirectly.
Neither Angel Broking Pvt. Limited, nor its directors, employees or affiliates shall be liable for any loss or damage that may arise from
or in connection with the use of this information.